Food Prep: How to Maximise Profit

In this article
- It Depends.
- 1. Understand your Average Demand and Variation
- 2. Understand your Costs & Margins
- 3. Balance Lost Sales vs Wasted Inventory - "Critical Ratio"
- 4. Proving the Accuracy of the Critical Ratio.
- 5. Should Anthony always prepare more than average demand?
- 6. How can we model more accurately?
- 7. How to maximize profit further!
A key challenge for kitchen operators is deciding the quantity of food to prepare. If managers under prepare, they lose sales. If they over prepare, they waste labour and food costs. This article will give managers a statistical method to optimise food preparation to maximise profit.
Typically, managers base their prep sheet off how many customers they have forecast for the next day. For example, if I expect 100 customers I’ll prepare 100 pizzas worth of inventory.
However, preparing for your estimated forecast is generally not profit maximising – because lost sales hurt. Should managers over prepare, under prepare and by how much?
It Depends.
We’d like to teach you a method to increase your profit by determining the optimal amount of food to prepare! To do this we’ll use a fictional case study of Anthony’s Burrito Shack. To keep it simple, Anthony only offers one type of burrito.
Problem to Solve: How many burritos should Anthony prepare tomorrow?
Optimise Food Preparation to Increase Profit Using Forecasting
1. Understand your Average Demand and Variation
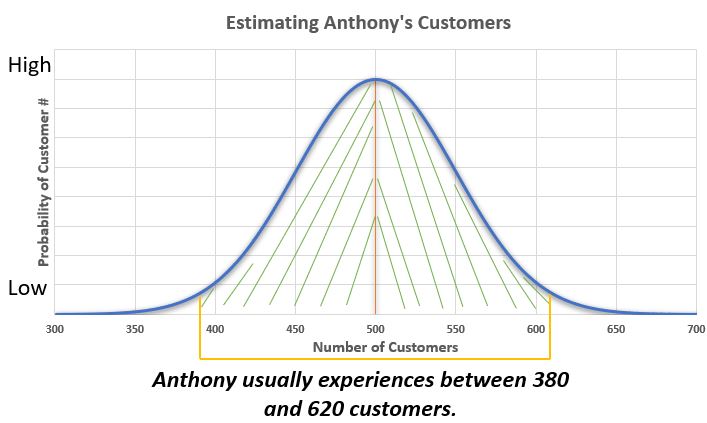
First and foremost, Anthony needs to estimate his demand tomorrow. Anthony has tracked how many customers visited per day over the last few months. Most managers will know their average demand – but variation is important as well. Variation reveals the probable range that Anthony can experience.
Anthony uses Excel’s “=AVERAGE” and “=STDEV” to gain insights on how many customers to expect tomorrow.
This returns an average of 500 and a standard deviation of 60 for Anthony.
On average, Anthony experiences 500 customers and his standard deviation reveals that he usually experiences between 380 and 620 customers .
Anthony knows his average demand and range but how many customers should he prepare for? How should he balance lost sales vs wasted inventory?
Next, we need to examine his costs before determining how many burritos to make (Hint: the answer is not 500).
2. Understand your Costs & Margins
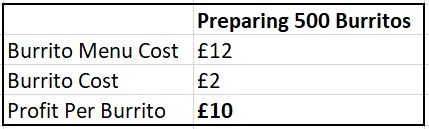
- Overage Cost: If Anthony over-prepares , he loses £2 per burrito
- Underage Cost: If Anthony under-prepares, he loses £10 per person – this is a lost sale
Note: We simplified Anthony’s shack – he only has one type of burrito. Usually, a percentage of your customers will order something else off the menu if you’re sold out. If Anthony offered two types of burritos he could take that into account and adjust his Underage Cost.
3. Balance Lost Sales vs Wasted Inventory – “Critical Ratio”
Now that Anthony understands his costs, he can calculate how many burritos to prepare!
In order to do this, Anthony needs to find his “critical ratio”.
This ratio determines the amount to prepare based off your costs. In other words, it optimises the amount of burritos that should be prepared to maximise profit by weighing lost sales vs wasted inventory.
Anthony finds that his Critical Ratio is 0.83, given by:
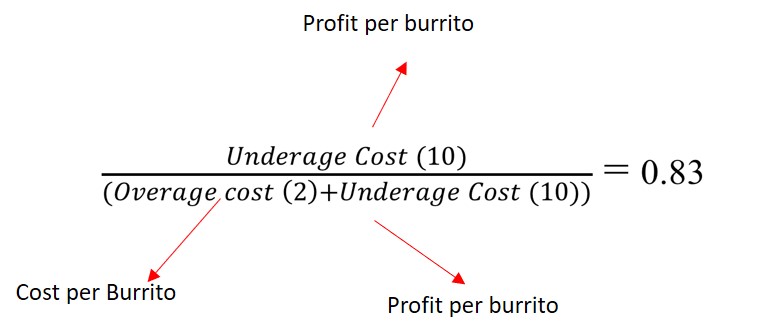
The 0.83 critical ratio means that he should prepare the number of burritos required to match customer demand 83% of the time. In other words, 17% of the time (about once a week) Anthony will probably not have enough burritos for every potential customer.
Anthony then needs to use Excel to find how many burritos will satisfy customers 83% of the time.
Use: =NORMINV(Critical Ratio, AVG Customers, Standard Deviation))) – This function will give the key number!
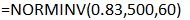
This function returns 558, which is the amount of burritos to prepare.
Anthony should prepare 558 burritos to maximise profit – even though his average is 500 customers!
4. Proving the Accuracy of the Critical Ratio.
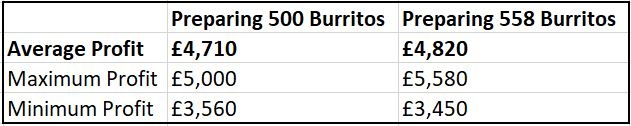
I’ll show the results of Anthony preparing 500 Burritos vs 558 Burritos to prove that using your critical ratio is profit maximising.
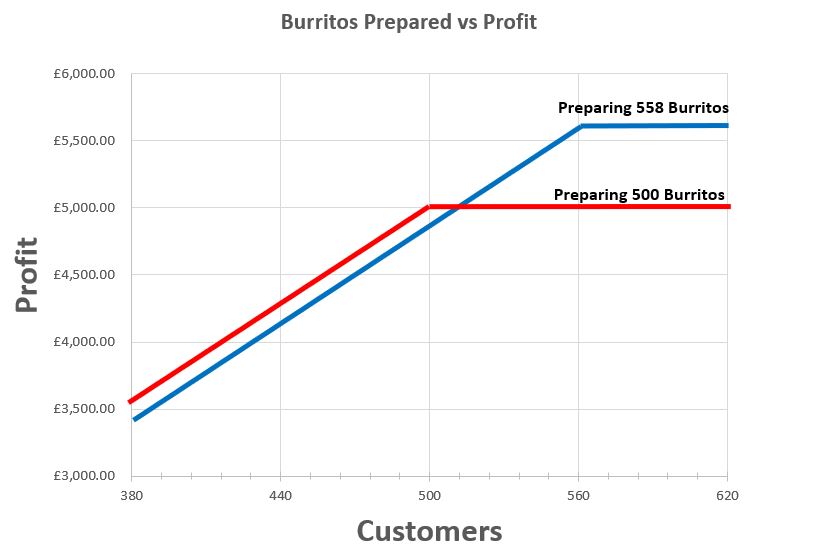
The chart above shows that preparing for 558 customers has a lot more upside than preparing for 500 customers. Conversely, If the customer demand is below 500 you barely make less money.
The critical ratio means that preparing more than 558 is not efficient! If Anthony made 580, because he wanted no lost sales, he would only make £4,770 on average – because the cost of the unsold burritos would outweigh the additional sales.
5. Should Anthony always prepare more than average demand?
The profit maximising quantity is based on your margins – your overage and underage costs. If the cost of Anthony’s ingredients raises to £10, the optimal quantity to prepare is 441, not 558, because unsold inventory is more damaging than lost sales.
6. How can we model more accurately?
If Anthony wants to improve his model he should examine the costs that go into his overage costs. Currently his overage cost is only determined by: Revenue of a Burrito – Cost of A Burrito (£12-£2 = £10).
However, the true cost is likely greater than that. He should look at storage costs for each burrito made (refrigeration costs) and staff costs that go into each burrito. Anthony might find that preparing the 58 extra burritos requires him to employee one more staff member.
Anthony might also be able to sell his leftover burritos at discount at his store, or over one of the great food reduction apps like Too Good to Go or Karma! This would also lower his overage cost – depending on the quantity and price of the reduced food.
Feel free to contact us for advice on how to include these more complex inputs!
7. How to maximize profit further!
Once you’ve been able to model your revenue maximizing quantity, the next step should be to increase the accuracy and precision of your demand forecast. We recommend using our forecasting module which has been shown to reduce forecasting error by over 50%!
You may also like